Headcount
| Ethnicity | |||||||||||||||||||
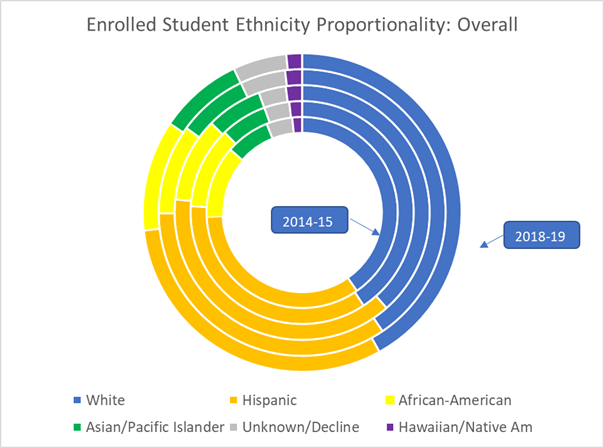
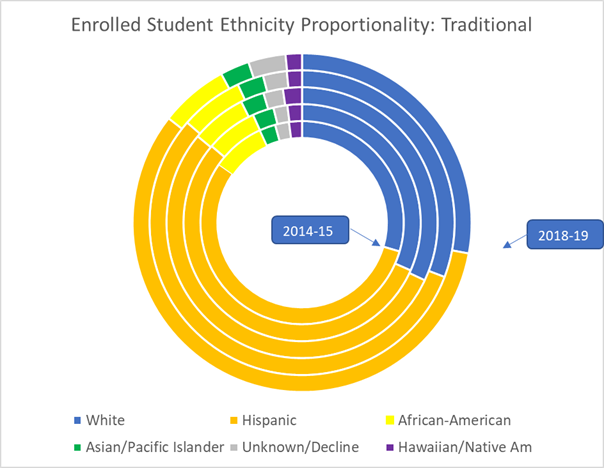
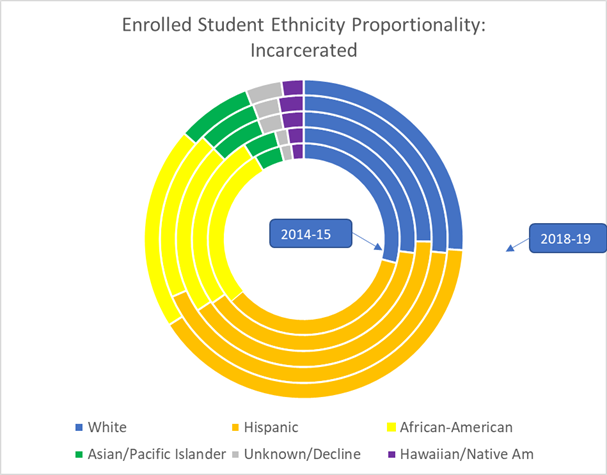
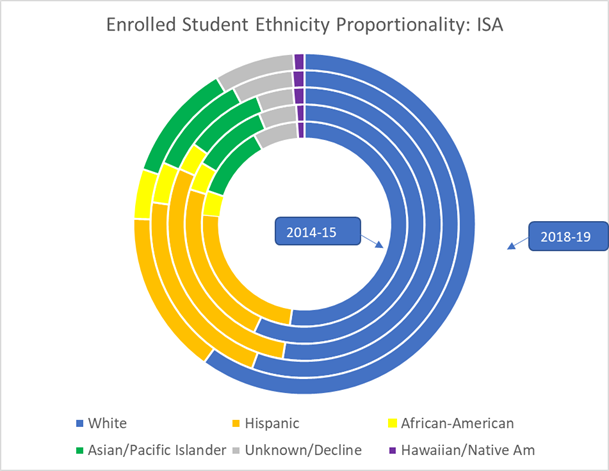
| Student ethnicity proportionality primarily reflects the communities being served. Ethnicity of incarcerated students demonstrates a higher percentage of non-white students while Fire Science/ISA trends a higher percentage of white students than the overall college's demographics. | |||||||||||||||||||
|
|
|||||||||||||||||||
| Ethnicity Unduplicated Headcount | 2014-15 | 2015-16 | 2016-17 | 2017-18 | 2018-19 | ||||||||||||||
| Asian/Pac Islander | 500 | 7.5% | 564 | 6.7% | 531 | 7.1% | 602 | 7.9% | 673 | 8.5% | |||||||||
| African-American | 814 | 12.2% | 994 | 11.9% | 801 | 10.7% | 771 | 10.1% | 888 | 11.2% | |||||||||
| Hawaiian/Nat Am | 111 | 1.7% | 155 | 1.8% | 154 | 2.1% | 145 | 1.9% | 126 | 1.6% | |||||||||
| Hispanic | 2,269 | 34.0% | 2,950 | 35.2% | 2,852 | 38.2% | 2,612 | 34.4% | 2,470 | 31.3% | |||||||||
| White | 2,692 | 40.3% | 3,413 | 40.7% | 2,875 | 38.5% | 3,080 | 40.5% | 3,315 | 41.9% | |||||||||
| Unknown | 160 | 2.4% | 218 | 2.6% | 183 | 2.4% | 242 | 3.2% | 301 | 3.8% | |||||||||
| Decline to State | 133 | 2.0% | 88 | 1.0% | 75 | 1.0% | 147 | 1.9% | 130 | 1.6% | |||||||||
|
|
|||||||||||||||||||
| Traditional Headcount | 2014-15 | 2015-16 | 2016-17 | 2017-18 | 2018-19 | ||||||||||||||
| Asian/Pac Islander | 36 | 2.6% | 38 | 2.9% | 37 | 2.8% | 33 | 2.8% | 32 | 2.8% | |||||||||
| African-American | 118 | 8.4% | 92 | 7.0% | 87 | 6.6% | 79 | 6.7% | 75 | 6.5% | |||||||||
| Hawaiian/Nat Am | 29 | 2.1% | 26 | 2.0% | 30 | 2.3% | 19 | 1.6% | 18 | 1.6% | |||||||||
| Hispanic | 774 | 55.2% | 715 | 54.6% | 714 | 54.0% | 659 | 55.6% | 663 | 57.7% | |||||||||
| White | 415 | 29.6% | 414 | 31.6% | 423 | 32.0% | 365 | 30.8% | 321 | 27.9% | |||||||||
| Unknown | 27 | 1.9% | 22 | 1.7% | 28 | 2.1% | 29 | 2.4% | 40 | 3.5% | |||||||||
| Decline to State | 4 | 0.3% | 3 | 0.2% | 3 | 0.2% | 1 | 0.1% | 1 | 0.1% | |||||||||
|
|
|||||||||||||||||||
| Incarcerated Headcount | 2014-15 | 2015-16 | 2016-17 | 2017-18 | 2018-19 | ||||||||||||||
| Asian/Pac Islander | 94 | 4.5% | 128 | 4.8% | 182 | 6.6% | 189 | 6.7% | 236 | 7.6% | |||||||||
| African-American | 575 | 27.7% | 688 | 25.8% | 603 | 22.0% | 541 | 19.1% | 641 | 20.6% | |||||||||
| Hawaiian/Nat Am | 44 | 2.1% | 64 | 2.4% | 79 | 2.9% | 81 | 2.9% | 70 | 2.2% | |||||||||
| Hispanic | 721 | 34.8% | 1,023 | 38.3% | 1,106 | 40.3% | 1,184 | 41.9% | 1,243 | 39.9% | |||||||||
| White | 602 | 29.0% | 721 | 27.0% | 695 | 25.3% | 750 | 26.5% | 814 | 26.1% | |||||||||
| Unknown | 20 | 1.0% | 40 | 1.5% | 77 | 2.8% | 72 | 2.5% | 107 | 3.4% | |||||||||
| Decline to State | 18 | 0.9% | 7 | 0.3% | 4 | 0.1% | 9 | 0.3% | 7 | 0.2% | |||||||||
|
|
|||||||||||||||||||
| ISA Headcount |
2014-15 | 2015-16 | 2016-17 | 2017-18 | 2018-19 | ||||||||||||||
| Asian/Pac Islander | 370 | 11.6% | 370 | 10.2% | 312 | 9.3% | 381 | 10.6% | 406 | 11.2% | |||||||||
| African-American | 121 | 3.8% | 140 | 3.9% | 111 | 3.3% | 151 | 4.2% | 172 | 4.7% | |||||||||
| Hawaiian/Nat Am | 38 | 1.2% | 41 | 1.1% | 45 | 1.3% | 45 | 1.3% | 38 | 1.0% | |||||||||
| Hispanic | 774 | 24.2% | 826 | 22.8% | 972 | 29.1% | 769 | 21.4% | 564 | 15.5% | |||||||||
| White | 1,675 | 52.3% | 2,065 | 56.9% | 1,758 | 52.6% | 1,966 | 54.8% | 2,181 | 60.0% | |||||||||
| Unknown | 113 | 3.5% | 105 | 2.9% | 78 | 2.3% | 141 | 3.9% | 154 | 4.2% | |||||||||
| Decline to State | 111 | 3.5% | 80 | 2.2% | 68 | 2.0% | 136 | 3.8% | 121 | 3.3% | |||||||||
| Source: Colleague ERP/Business Objects | |||||||||||||||||||